Note
Go to the end to download the full example code.
Paragraphs of long text
To typeset long text as one or several paragraphs the pygmt.Figure.paragraph
method can be used. The parwidth and linespacing parameters allow to set
the width of the paragraph and line spacing, respectively. The desired text can
be provided using two ways to indicate a new paragraph:
a single string separated by a blank line
a list of strings, whereby each string needs to end with a white space
During plotting the paragraphs are automatically separated by a blank line.
For details on text formatting see the gallery example Text formatting.
import pygmt
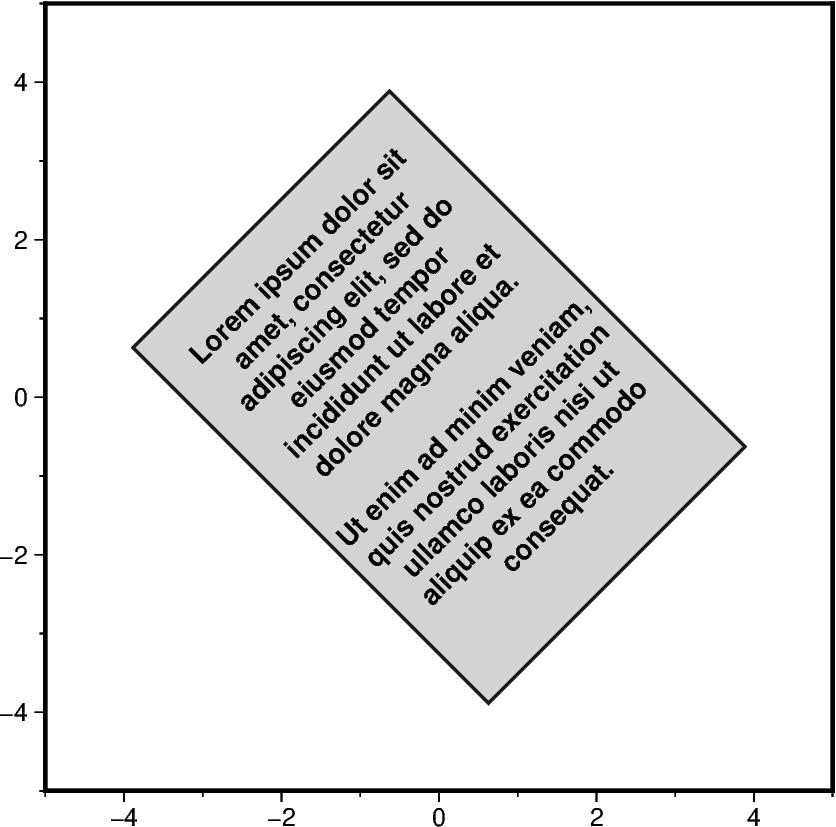
text = [
"Lorem ipsum dolor sit amet, consectetur adipiscing elit, sed do eiusmod tempor incididunt ut labore et dolore magna aliqua. ",
"Ut enim ad minim veniam, quis nostrud exercitation ullamco laboris nisi ut aliquip ex ea commodo consequat.",
]
fig = pygmt.Figure()
fig.basemap(region=[-5, 5, -5, 5], projection="X10c/10c", frame=True)
fig.paragraph(
text=text,
x=0,
y=0,
parwidth="4.5c",
linespacing="12p",
alignment="center",
justify="MC",
angle=45,
font="10p,Helvetica-Bold,steelblue",
fill="lightgray", # font color ignored
pen="1p,gray10", # font color ignored
)
fig.show()
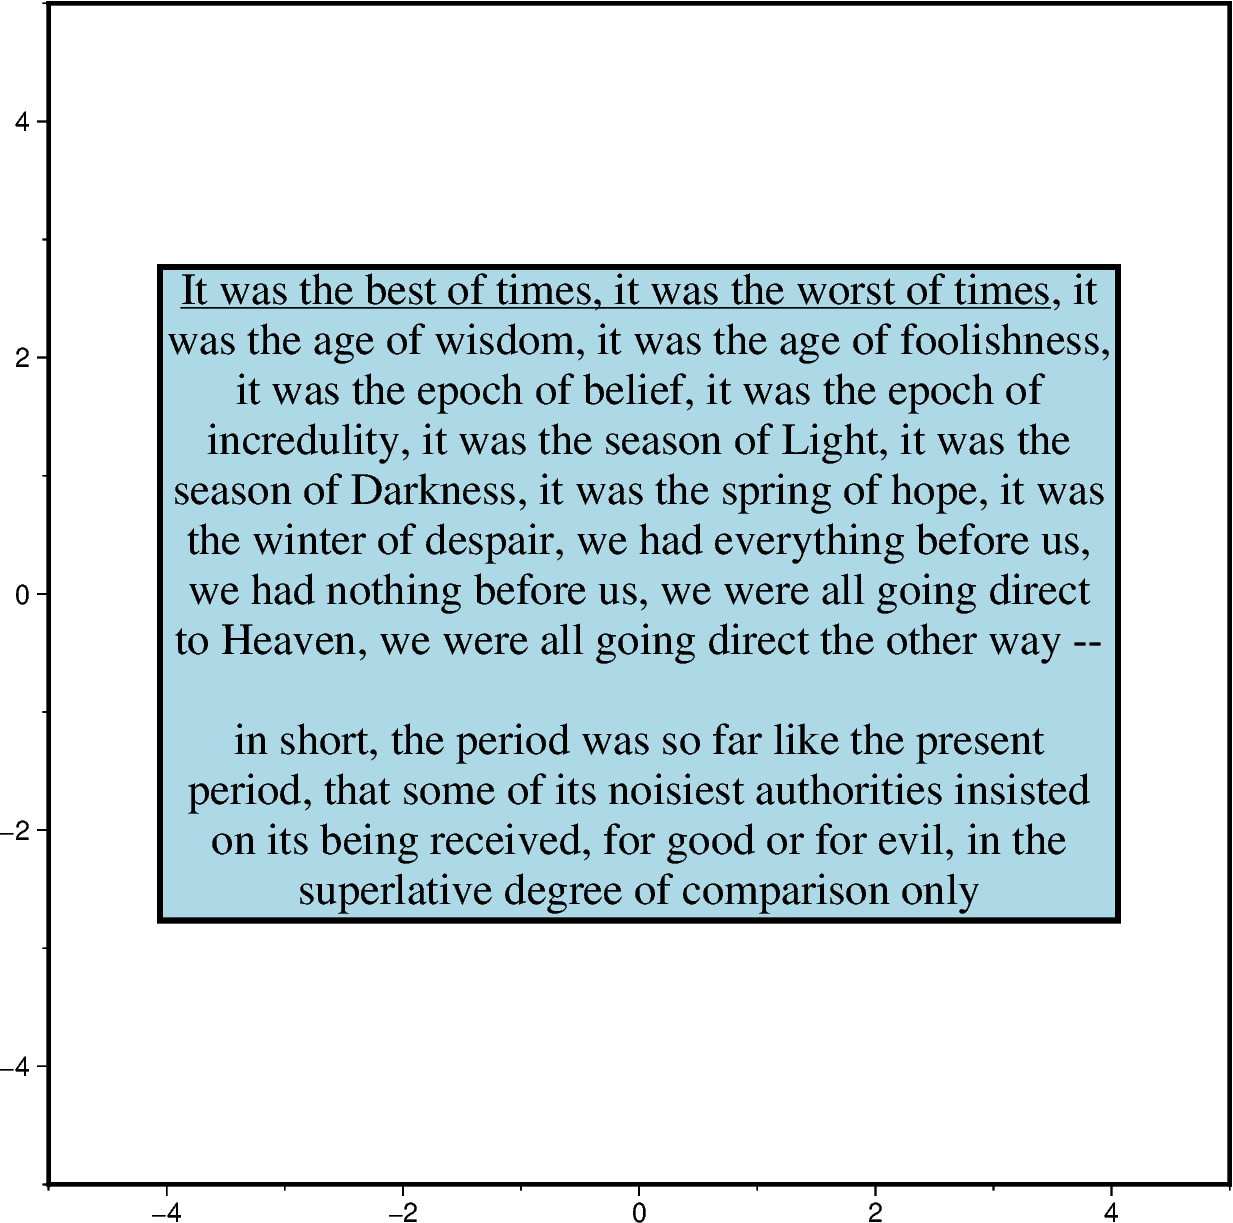
text = [
    "@_It was the best of times, it was the worst of times@_, it was the age of wisdom, it was the age of foolishness, it was the epoch of belief, it was the epoch of incredulity, it was the season of Light, it was the season of Darkness, it was the spring of hope, it was the winter of despair, we had everything before us, we had nothing before us, we were all going direct to Heaven, we were all going direct the other way -- ",
    "in short, the period was so far like the present period, that some of its noisiest authorities insisted on its being received, for good or for evil, in the superlative degree of comparison only",
]

fig = pygmt.Figure()
fig.basemap(region=[-5, 5, -5, 5], projection="X15c/15c", frame=True)

fig.paragraph(
    text=text,
    x=0,
    y=0,
    parwidth="12c",
    linespacing="18p",
    alignment="center",
    justify="MC",
    font="16p,Times-Roman,red",  # should now work with fill
    fill="lightblue",
    pen="2p",
    # S="8p/-8p/darkblue",  # not supported yet
    # C="8p+tc",  # not supported yet
)

fig.show()
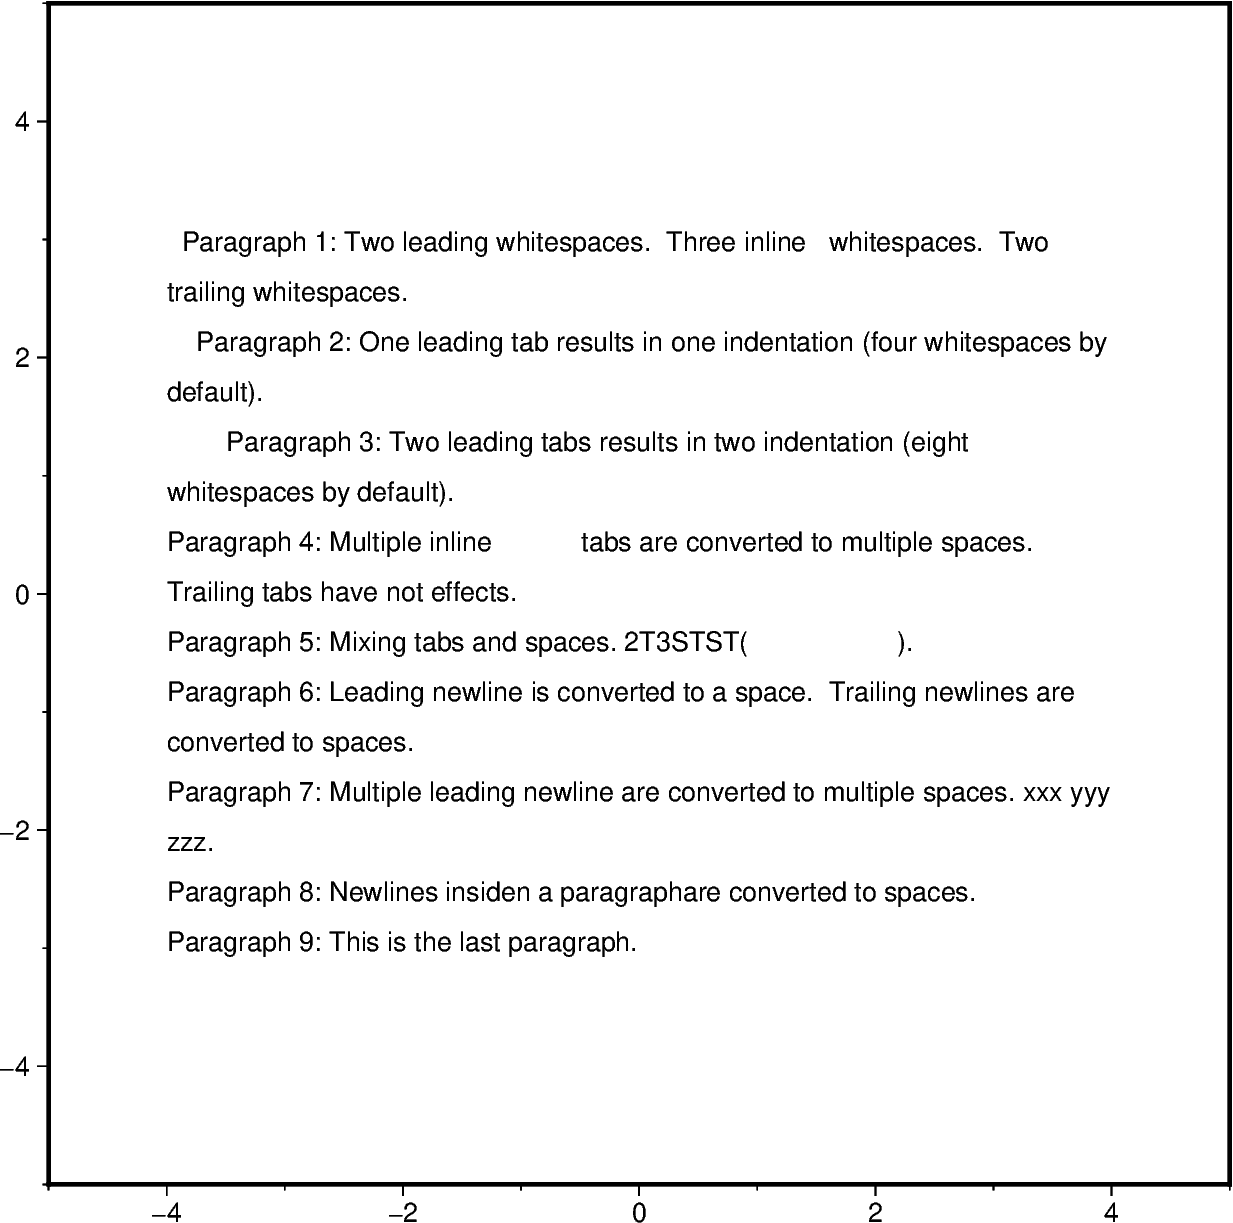
taken from pygmt/tests/test_paragraph.py
text = [
    "  Paragraph 1: Two leading whitespaces. Three inline   whitespaces. Two trailing whitespaces.  ",
    "       Paragraph 2: One leading tab results in one indentation (four whitespaces by default).",
    "               Paragraph 3: Two leading tabs results in two indentation (eight whitespaces by default).",
    "Paragraph 4: Multiple inline                   tabs are converted to multiple spaces. Trailing tabs have not effects.          ",
    "Paragraph 5: Mixing tabs and spaces. 2T3STST(                          ).",
    "\nParagraph 6: Leading newline is converted to a space. Trailing newlines are converted to spaces.\n\n",
    "\n\nParagraph 7: Multiple leading newline are converted to multiple spaces. xxx yyy zzz.",
    "Paragraph 8: Newlines insiden a paragraph\nare converted to spaces.",
    "Paragraph 9: This is the last paragraph.",
]

fig = pygmt.Figure()
fig.basemap(region=[-5, 5, -5, 5], projection="X15c/15c", frame=True)

fig.paragraph(
    text=text,
    x=0,
    y=0,
    parwidth="12c",
    linespacing="18p",
)

fig.show()
Total running time of the script: (0 minutes 0.700 seconds)